Phase Diagrams
Phase diagrams are very important in material science as it allows us to see the correlation between microstructure and mechanical properties of a material.
First let’s go over a few definitions. A component is a pure metal or compound that is part of an alloy, for example carbon steel is a binary alloy made up of Fe and C, the components. A phase is a homogeneous portion of a system with uniform physical and chemical characteristics. A phase can be made up of multiple components as well. For example, a solution of water and sugar may have one phase that is a syrup solution and another phase of undissolved solid sugar. Each of these things have their own physical properties (one liquid and one solid), and they also have different chemical compositions
A system with a single phase is known as a homogeneous system whereas systems with two or more phases are known as heterogeneous systems or mixtures.
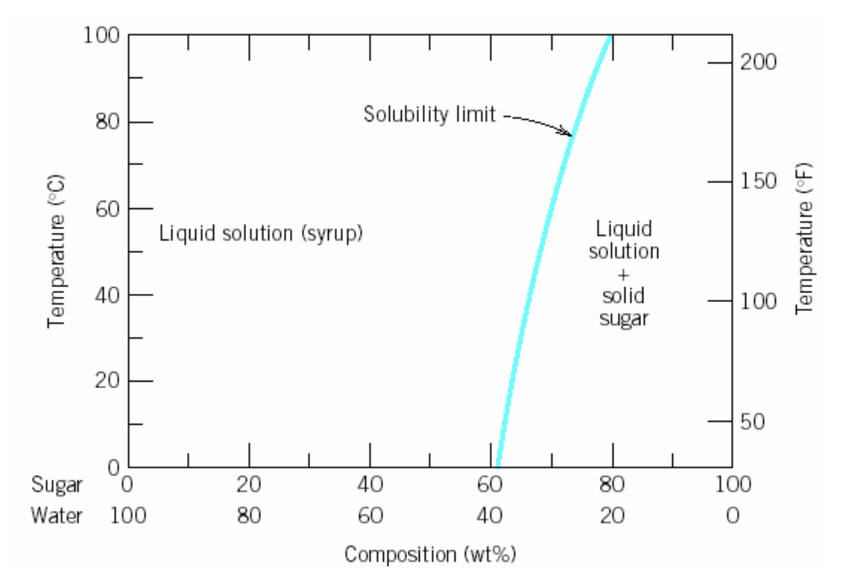
The figure below shows the example of sugar and water mentioned above. We can see the two substances separated by the solubility limit. The solubility limit is the maximum concentration of solute that is able to dissolve in the solvent at a given temperature. To the left of the line is the liquid syrup and to the right is the syrup plus solid sugar.
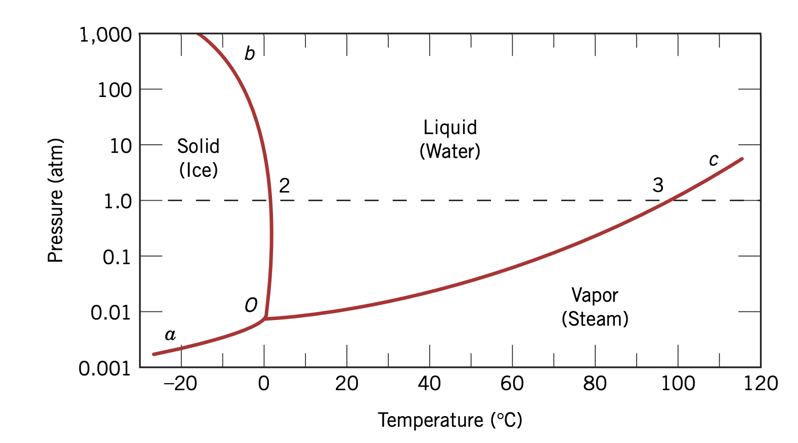
A system is at equilibrium when the system is stable and not changing with time at a constant temperature, pressure, and composition. The phase diagram is a graphical representation of all the equilibrium phases. For one component systems, such as water, the phase diagram is made up of 2 parameters such as volume, temperature, or pressure. The phase diagram for water using pressure and temperature can be seen below.
Practice Problems 1
- Consider the first figure of the sugar water system above. How much sugar will dissolve in 1000 g of water at 80° C (176° F)?
- If the saturated liquid solution in number 1 is cooled to 20° C (68° F), some of the sugar precipitates as a solid. What will be the composition of the saturated liquid solution (in wt% sugar) at 20° C?
- Looking at the phase diagram for water, what is the melting point at 100 atmn? What is the boiling point at 100 atm?
- The point where all the lines in the phase diagram meet is called the triple point. What do you think this is? What states exist here?
Phase Diagrams for Binary Systems
Previously we looked at single component phase diagrams, but looking at two component phase diagrams can help us predict phase changes and microstructures at certain temperatures. It's possible to have multi-component phase diagrams, but generally if more than two components are present, phase diagrams are extremely complicated to represent, so the furthest we will look at are binary systems.
An isomorphous binary system is one that has complete solid solubility of the two components (both in the liquid and solid phases). For these, the solid has the same structure for all compositions. For example we can look at a simple phase diagram for copper-nickel below.
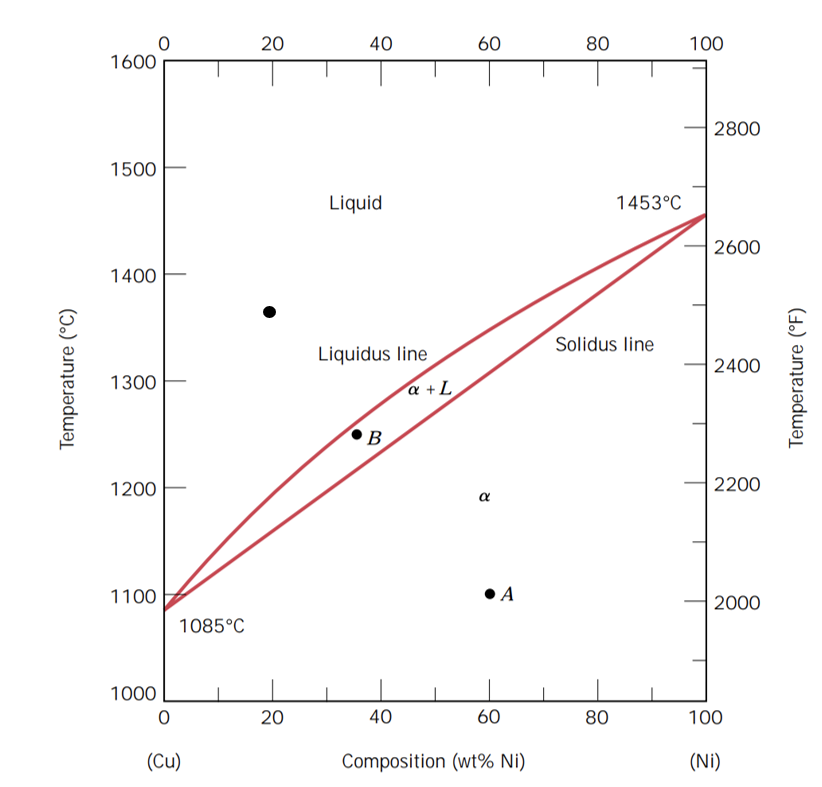
Here we can see the composition in weight percent of nickel is shown on x-axes, and the temperature is shown in both Fahrenheit and Celsius on the Y-axes. We can see the three phases labeled on the diagram as well, the liquid phase (L), the solid + liquid (α + L), and the solid phase (α).
As seen before in the one-component system of water, a melting point occurs at a very distinct line. Here, in a two-component system, the melting occurs over a range of temperatures, between the liquidus and solidus line.
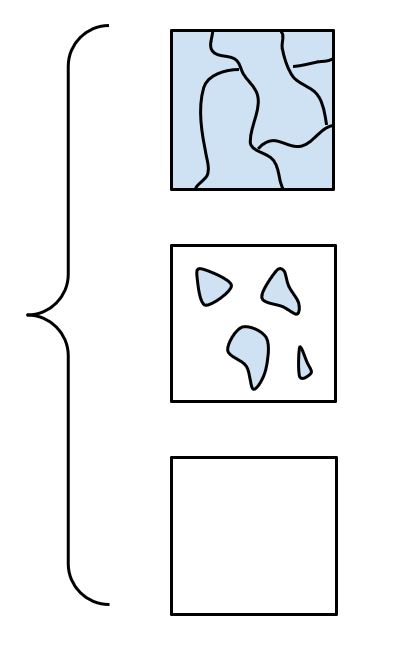
Here we can see the microstructures that we would find in each phase of the solution.
The first square corresponds to the region A, which is a polycrystalline solid solution.
The middle square represents region B, in between the solidus and liquidus line, and it is a mixture of liquid and crystallites of the solid solution.
The last square is region C, which is just the liquid solution.
Practice Problems 2
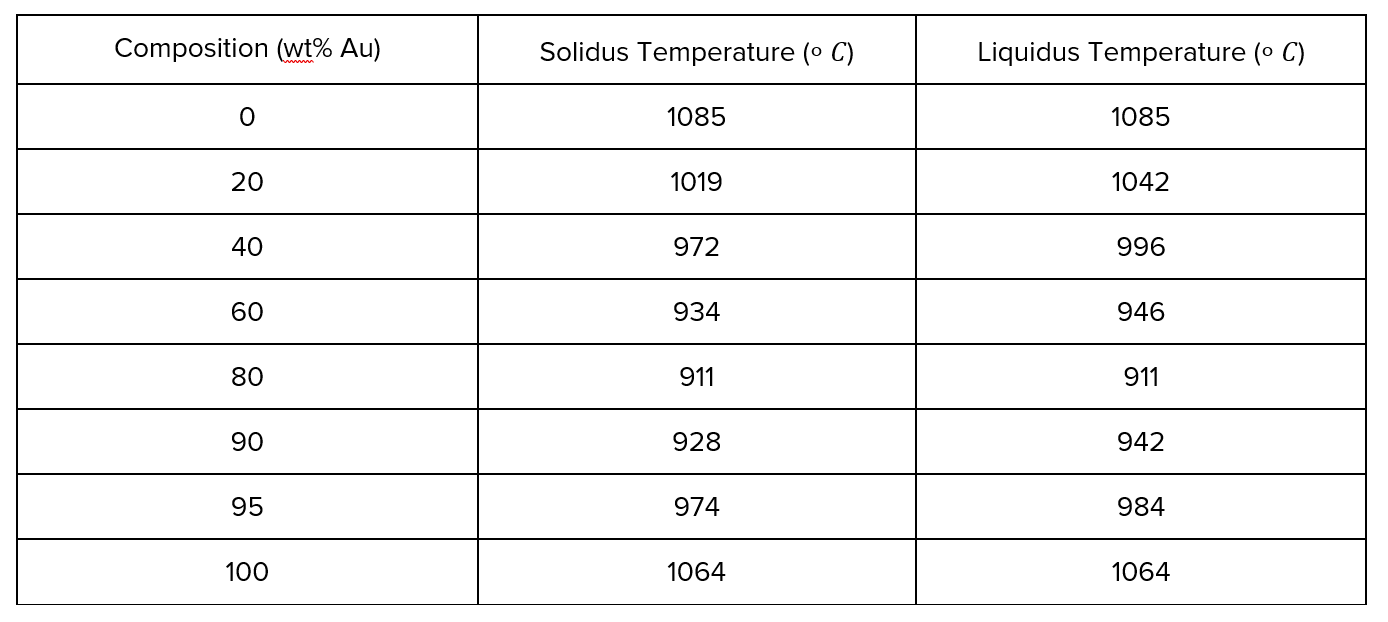
Use this given table of solidus and liquidus temperatures for the copper-gold system to construct a phase diagram. Label each region.
Lever Rule
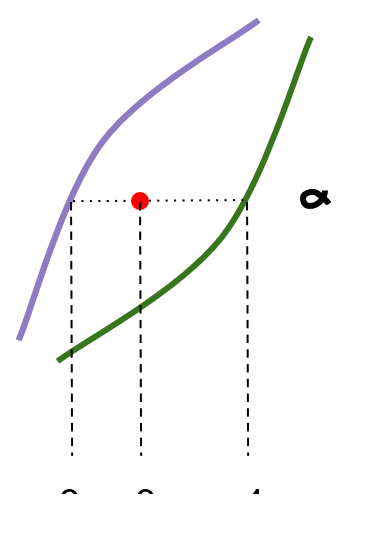
The lever rule is something that is used to determine the fraction of liquid and solid phases for a given binary system and temperature. This is done by using something called a tie line. First we mark where we would like to know the mass fraction, and draw lines over to the boundaries to find where it meets the bounds of liquid and solid. From this we can determine the mole fraction (xi) or the mass fraction (wi) using these formulas:
Where C is the composition percentage and w is the weight percent.
For example, take a look at the graph below. Lets say we wanted to know the weight percent at a given temperature with 35% composition. That would be our C0. Then we would draw a line at the same temperature to find the CL and Cα, where α is our solid. We then have all the parts to use the equations above.
Practice Problems 3
- Solve for wL and wα from the example up above
- A hypothetical A–B alloy of composition 40 wt% B–60 wt% A at some temperature is found to consist of mass fractions of 0.66 and 0.34 for the α and β phases, respectively. If the composition of the α phase is 13 wt% B–87 wt% A, what is the composition of the β phase?
Binary Eutectic Phase Diagrams
Binary eutectic phase diagrams are what happens when you mix two things together that don’t follow the typical rules of solid solution mixing. This could be due to differences in crystal structures, large distance of valences, etc.
Here is an example of a Cu-Ag phase diagram:
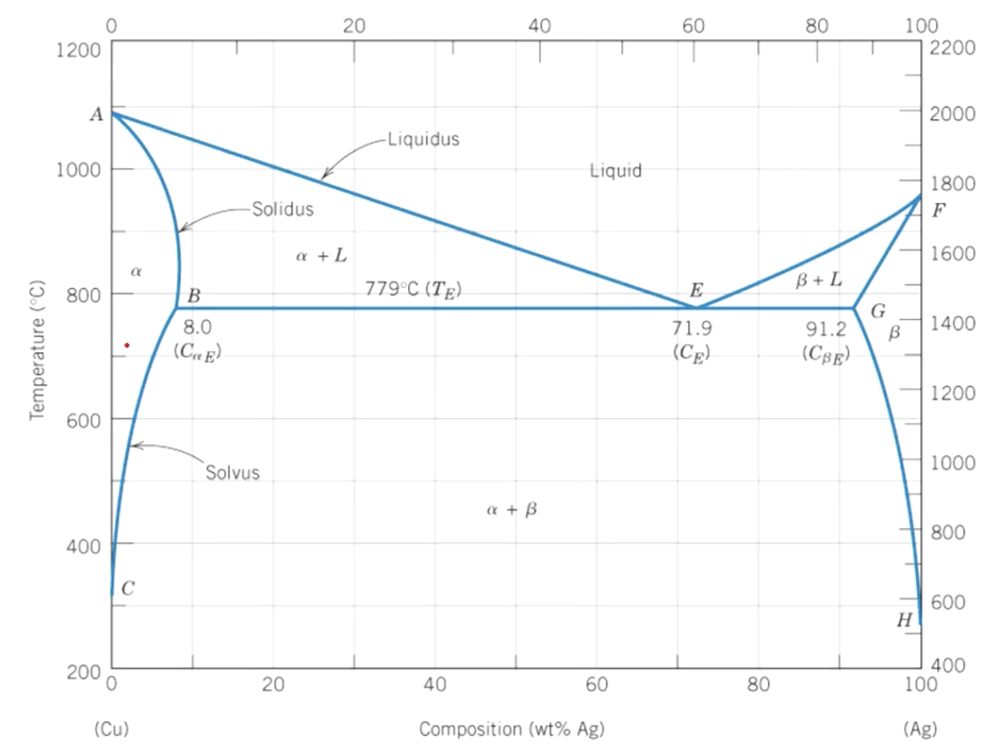
The single phase regions are:
α -- Solid solution rich Cu
β -- Solid solution rich Ag
L -- Liquid solution
There are also 2-phase coexistence regions. You can easily identify and label these as they are made up of the 2 phases on each side. Here we have α+β, α+L, and β+L.
Tie-lines and the lever rule can be used in the 2-phase regions like before.
The point labeled ‘E’ is known as a eutectic point. This is the point where 2 liquidus lines meet. It is also known as an invariant point. This is interesting as the liquid goes straight into the solid solutions. The horizontal line that follows the point ‘E’ is known as the eutectic isotherm.
So how do we determine microstructure from these diagrams? We can determine them from where we are in the diagram:
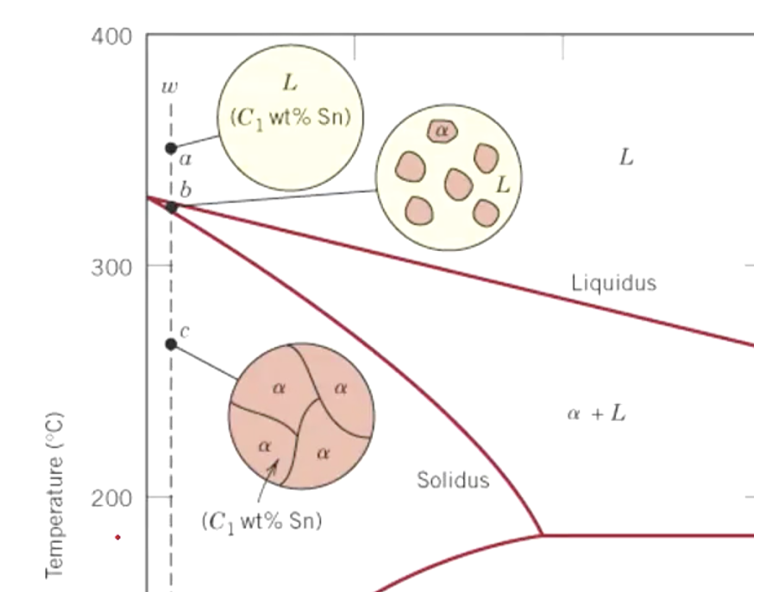
a -- point a is completly in the liquid region
b -- point b is α--phase solids with liquid compositions. The exact mass fractions can be found using the lever rule.
c -- point c is in the α--solid area only
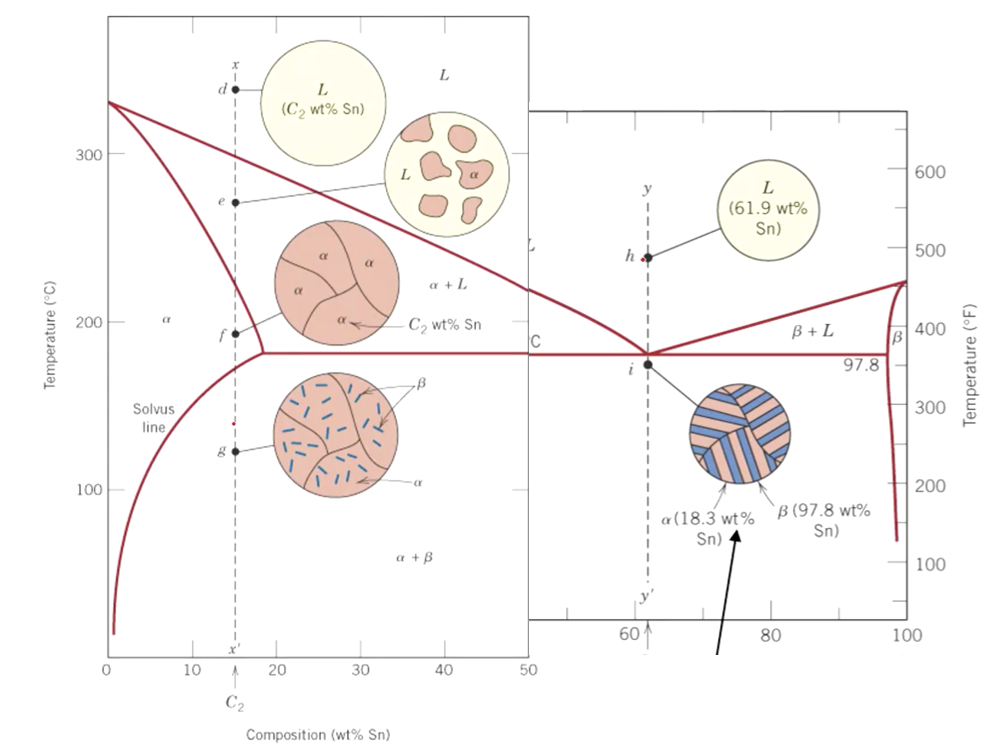
Points d, e, f, and h follow the same pattern as points a,b, and c above.
Point g shows solid α with some β precipitating out as we have passed through the solvus line therefore exceeding the solubility limit.
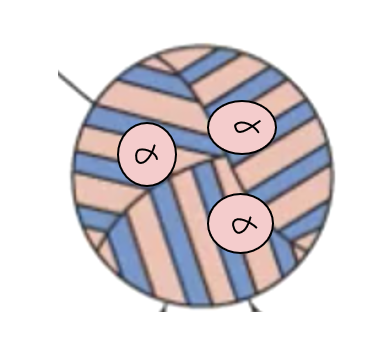
At point i, we have solidification over the eutectic, so we are given a lamellar structure of α and β. This happens as solids diffuse much slower than liquids. Any time we cross over the eutectic lamellar we are given this type of structure, though if it is past the eutectic point to the left or right, we will also get some α or β precipitated out. For example, at 100°C and 30% Sn, we are to the left of the eutectic point, but have still crossed over the eutectic isotherm so our microstructure would look like this:
Practice Problems 4
-
Construct the hypothetical phase diagram for metals A and B between temperatures of 600° C and 1000° C given the following information:
- The melting temperature of metal A is 940°C.
- The solubility of B in A is negligible at all temperatures.
- The melting temperature of metal B is 830°C.
- The maximum solubility of A in B is 12wt% A, which occurs at 700°C.
- At 600°C, the solubility of A in B is 8wt% A.
- One eutectic occurs at 700°C and 75wt% B-25wt% A.
- A second eutectic occurs at 730°C and 60wt% B-40wt% A.
- A third eutectic occurs at 755°C and 40wt% B-60wt% A.
- One congruent melting point occurs at 780°C and 51wt% B-49wt% A.
- A second congruent melting point occurs at 755°C and 67wt% B-33wt% A.
- The intermetallic compound AB exists at 51wt% B-49wt% A.
- The intermetallic compound AB2 exists at 67wt% B-33wt% A.
-
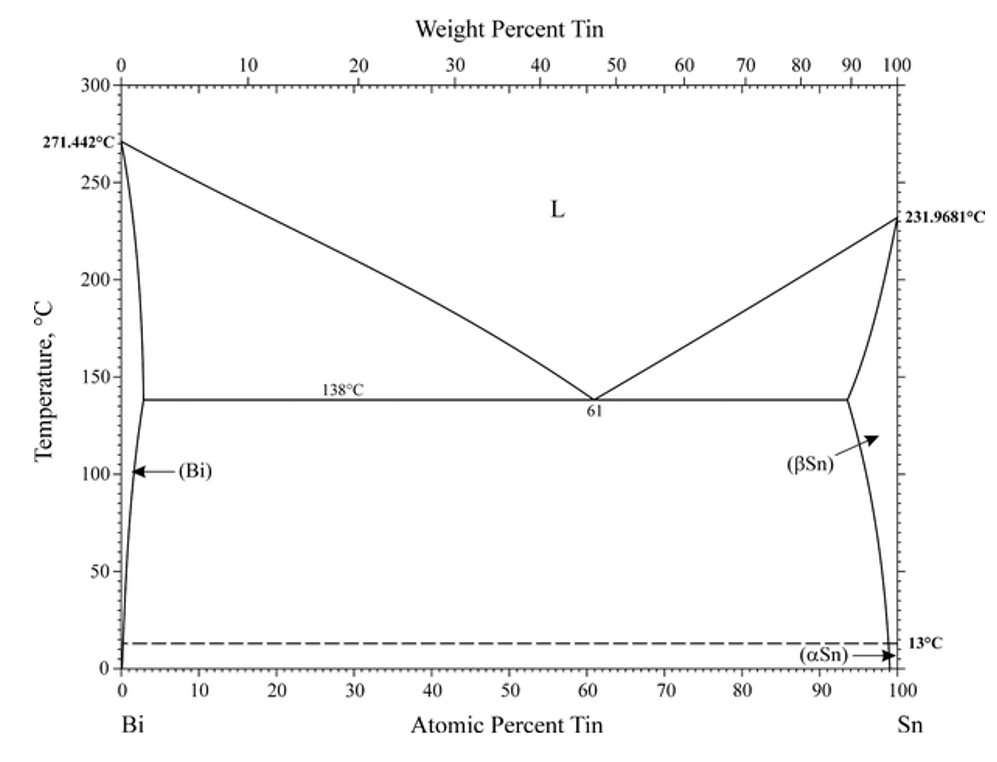
Properly label the following Bi-Sn phase diagram:
-
Draw the microstructures for the following from the phase diagram above:
- 20% tin at 100°c
- 20% tin at 200°C
- 80% tin at 100°c
- 50% tin at 200°C